The Best Stock Analysis App for Fundamental Investors

Institutional-grade stock research. Built for self-directed investors who refuse to compromise on returns or their values.
Access Research
Start free. No credit card required.
Image depicting screen quick view of stocksZiggma free stock screener on desktop and Nvidia stock score on mobile

Hundreds of Fundamentals. One Score. Instantly Know Which Stocks Win.

Millions of data points. One score. Every stock ranked against its peers — so you know exactly where it stands before you invest a dollar.

Unlock Stock Scores
Card explaining how the Ziggma Stock Score works

High-Speed Screener for Stocks, ETFs and Mutual Funds

Choose from analyst-curated screens or build your own in seconds. Filter 6,000+ stocks, ETFs and mutual funds by fundamentals, values alignment, or both.

Screen Now
This screener view shows preset screens, such as climate action and exclude fossil fuel.

Impact Investing -Where Big Problems Meet Big Opportunity

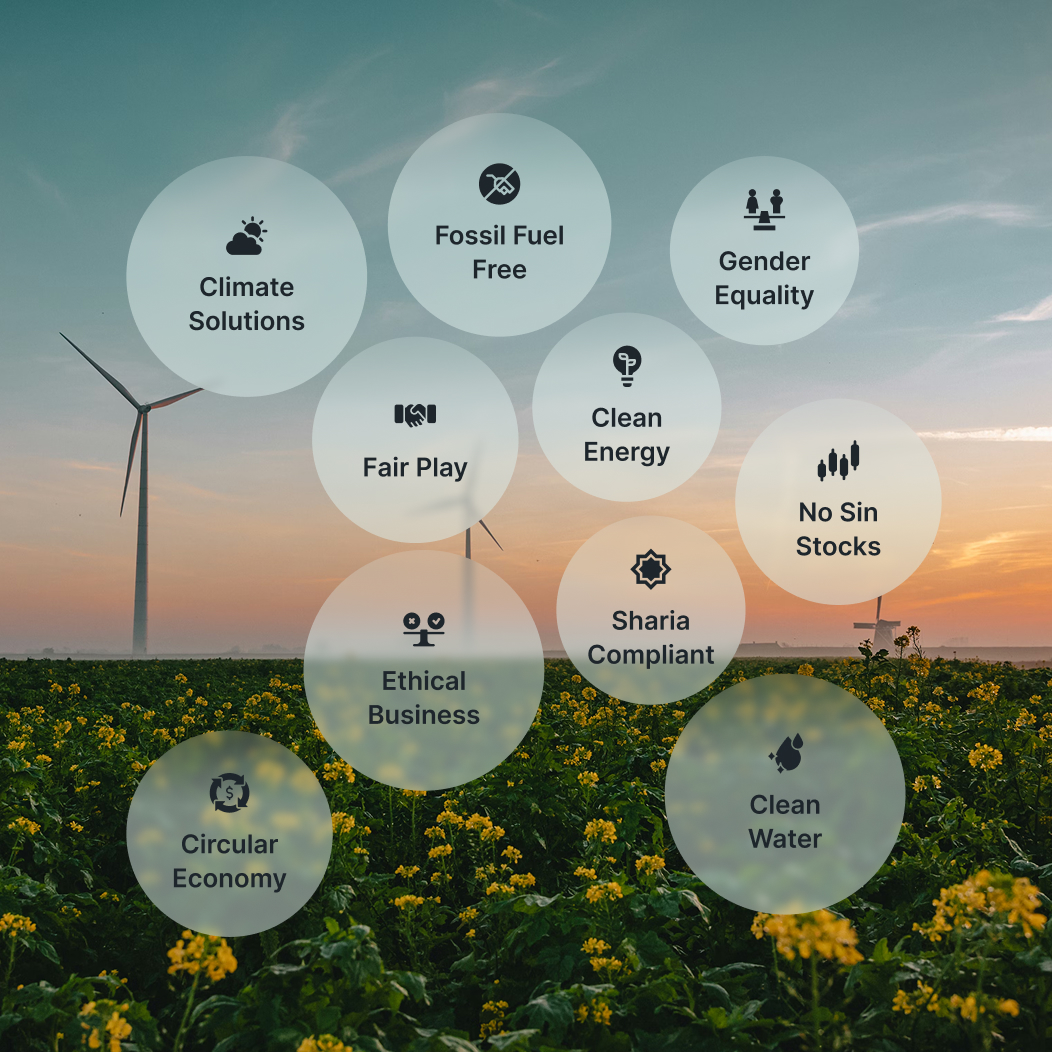
The companies tackling climate, inequality and the energy transition aren't just doing good — many are outperforming the market. Ziggma's impact investing screens find them for you, filtered by both financial quality and real-world impact.

Screen Now
overview of impact investing opportunities

FAQ: Stock Analysis App

Ziggma is a stock research and portfolio analysis platform built for self-directed investors. It combines fundamental stock scoring, a high-speed screener, portfolio tracking and impact investing tools in one place — free to start, no credit card required.

The Ziggma Stock Score is a proprietary 0–100 score that distills millions of data points — across growth, profitability, valuation, financial health and industry-specific KPIs — into a single number. Every stock is ranked against its industry peers, so a score of 80 means the stock outperforms 80% of companies in its sector on fundamentals. Scores are updated daily.

Yes. Ziggma's core features — including stock scores, stock profiles and the screener — are free to access. No credit card required. Premium plans unlock additional depth and portfolio features. See pricing for details.

Ziggma scores all US-listed stocks with a market cap above $100 million — over 6,000 companies in total. This threshold filters out zombie companies, SPACs and early-stage startups with edge-case financials that would distort peer comparisons.

The Ziggma screener lets you filter stocks, ETFs and mutual funds by fundamentals, values alignment, or both — in seconds. Choose from analyst-curated preset screens (including climate action, fossil-free and high-growth) or build a fully custom screen using your own criteria.

Yes — and it is one of Ziggma's core differentiators. The platform includes dedicated impact investing screens across themes like clean energy, climate and social equity, all scored on the same rigorous fundamental criteria as every other stock. You can also build a fossil-free portfolio, reduce your portfolio's climate impact and spot greenwashing in your existing holdings.

The best stock analysis app for fundamental investors combines deep financial data, peer benchmarking and an intuitive interface — without requiring a Bloomberg terminal or a finance degree. Ziggma was built specifically for this: its Stock Score processes 50+ fundamental indicators per stock, ranks each against industry peers, and surfaces the results in a clean, actionable format. Get started free.

Ziggma and Morningstar serve different needs. Morningstar is strong on fund research and analyst reports; Ziggma is built for active self-directed investors who want fast, quantitative fundamental screening and portfolio analysis tools at a fraction of the cost. See the full breakdown on our Ziggma vs. Morningstar page.

Yes. Ziggma's portfolio tracker lets you monitor holdings across multiple accounts in one place. From there, the Portfolio Checkup grades your portfolio on fundamentals, diversification and risk, while the Portfolio Optimizer suggests improvements based on your goals.

Stock scores and price data are updated daily, capturing new data points on both prices and fundamentals. This ensures the scores you see always reflect the most current available information.

Ziggma's algorithm processes 50+ financial indicators across four dimensions: Growth (revenue, earnings, cash flow trends), Profitability (margins, return on equity, return on assets), Valuation (P/E, P/B, EV/EBITDA and peers) and Financial Health (debt levels, liquidity, interest coverage). For banks, REITs and insurers, industry-specific KPIs such as net interest margin and loan-to-value replace metrics that do not apply.

Create a free account in seconds — no credit card required. From there, search any stock to see its Ziggma Score and full fundamental profile, or head to the screener to find your next opportunity. Not sure where to begin? Check out the Big Board in the left-hand menu for the stocks with the biggest moves today.