
Have you ever looked into a potential investment and wondered what all the numbers in a stock quote represent? While there is a lot to digest, each has a specific purpose, and understanding what a stock quote represents can help you buy or sell an investment at the best price possible.
What is a Stock Quote?
A stock quote is a snapshot of how a particular stock, such as AAPL 📈 or TSLA 📈 is performing at any given moment. It shows the stock’s current price and the highest and lowest prices for the current trading day. You’ll also see the stock’s price at the open and where it closed the previous day.
Other details included on a price quote include the bid and ask price and trading volume. Each of these numbers in a stock quote are essential for understanding if it’s a good time to buy or sell shares.
Get free real-time stock quotes and stock research with Ziggma.
Components of a Stock Quote
When you look up a stock quote, all the numbers can be a little overwhelming to someone with limited investing experience. However, they all play a big part in how a particular stock trades.
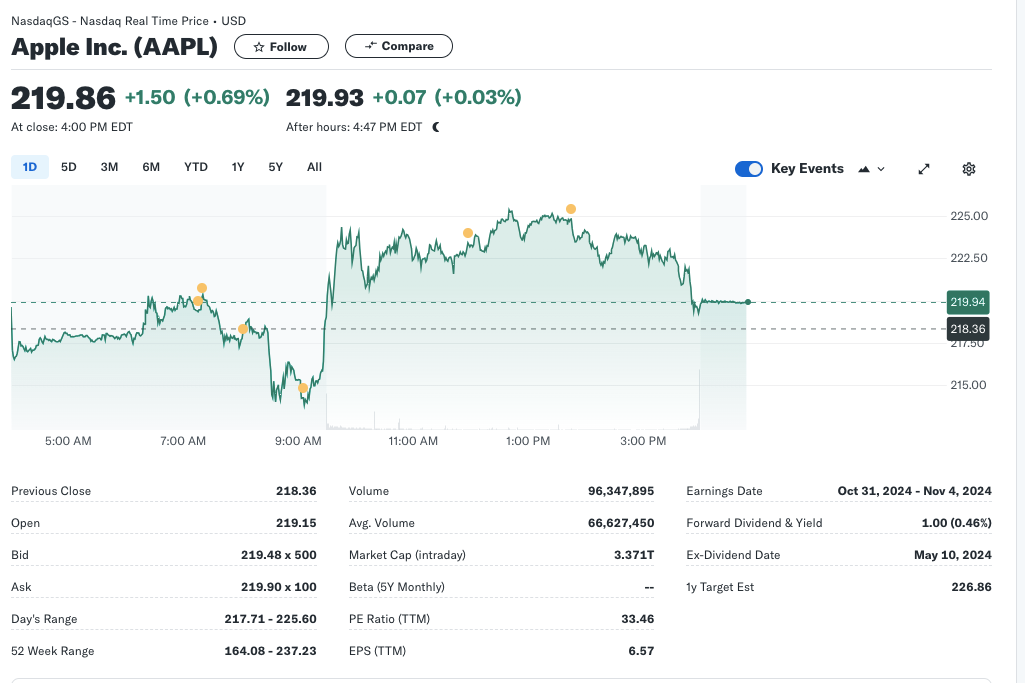
Below is a stock quote for Apple with an overview of some of the numbers.
Ticker Symbol
Each company listed on a stock exchange has a ticker symbol, which is a combination of several letters. This symbol is a simple way to identify the company within investment transactions. For example, Apple’s ticker symbol is AAPL 📈.
Last Price
One of the more significant pieces of a stock quote is the last price. This is the most recent price that the company traded at. For example, in the screenshot above, Apple’s last traded price was $219.86 at the close, but its last price in after-hours trading was $219.93.
Previous Close
The previous close is the stock’s price on the previous trading day.
Open Price
While sometimes the open price will be the same as the previous close, this isn’t always the case. For example, if the company reported earnings after the close or had significant news about the company, the stock price could open above or below where it closed the previous day.
Bid/Ask
In every stock transaction there is a bid price and an ask price. The bid price represents the maximum a buyer is willing to pay for a single share of the listed stock. Whereas the ask price is the minimum amount a seller is willing to receive for that share. Many times, stock quotes will also list the number of shares available. For example, the bid price above has a maximum share amount of 500 at that particular price.
Also Read: Bid vs Ask Price
Trading Volume
Trading volume indicates the amount of shares being bought and sold over a period of time, usually the trading day. The volume is a good indicator of how liquid a stock is. High volume means it’s going to be easy to buy and sell. However, it can also mean high volatility, meaning the price can fluctuate quickly.
Average Volume
Most stock quotes also include the average trading volume, which is calculated over a period of time. Typically, if a stock price is moving up or down and the trading volume is above average, this is thought to be a strong price movement. There’s something behind the movement. However, if volume is relatively weak, then it might be a shorter-term move for the stock price.
Dividend Yield
Dividend yield is an important part of the stock quote if you’re specifically looking for companies that pay out a dividend to shareholders. The dividend yield listed on the stock quote will show you both the dollar amount per share owned as well as the yield that represents.
Ex-Dividend Date
This is the date that you must have been a shareholder if you want to be entitled to a dividend payment. If you purchase on or after the ex-dividend date, you will not be entitled to a dividend payment until the next period.
PE Ratio
The PE ratio is important for understanding how expensive a particular stock is. It compares the current stock price with the company’s earnings. Typically, a low PE ratio means the stock is cheap. Whereas, a high PE ratio indicates the stock price is expensive compared to the company’s earnings. PE Ratios can also be found in Ziggma’s free portfolio tracker.
Earnings Per Share
Another key metric for understanding the financial health of a company is earnings per share (EPS). This is the company’s net profit divided by the total number of common shares outstanding.
52-Week Range
While many investors might not think too much of the 52-week range listed on a stock quote, this can be a good indicator of a stocks current momentum. The 52-week range is the highest price and lowest price that a stock has traded over the past year.
Beta
Beta isn’t always going to be listed on a stock quote, but when it is, it represents how sensitive an individual stock is to the overall stock market. When a company has a beta of 1, the stock trades similarly to the market. However, if the beta is 0.9, it moves 10% less than the market.
How to Read a Stock Quote
Stock quotes change throughout the day. If you’re looking at the chart for a popular stock like Apple, it could change frequently because thousands of trades are completed every minute. However, a stock quote for a company with a small volume could stay constant for a period of time.
When you read a stock quote, the first thing you want to do is identify the current trading price and then look at the bid/ask price. This will give you an idea of the direction in which the stock price is moving.
Also, pay attention to the trading volume compared to the stock’s average daily volume. A lot of volume usually means something has happened. Unless you’re a day trader, be careful buying and selling when there is market-moving news about a company. Chasing a price when buying or selling can lead to unfavorable outcomes.
The Bottom Line
Understanding what a stock quote represents is important before investing in a company. Certain metrics, like the bid/ask, will help you understand the direction a stock price is moving. If you’re looking for dividend-paying stocks, you’ll be able to find this information as well (you can also use Ziggma’s free stock screener).