Best Portfolio Analysis Tools for Individual Investors (2026)

Presentation of the best portfolio analysis tools


Most investment tools are built around individual stocks. They help you decide what to buy. Very few help you understand what you already own.

That's a different problem — and a more important one for most investors. A portfolio of individually researched stocks can still be poorly diversified, dangerously concentrated in one sector, or weighed down by a handful of holdings with deteriorating fundamentals. Price and return data won't tell you any of that.

Portfolio analysis tools are built to answer the harder questions: How concentrated is my risk, really? Which holdings are reducing overall quality? Am I diversified across sectors and geographies — or just holding variations of the same bet? How do my accounts work together when I look at them as one portfolio?

This guide covers the four best portfolio analysis tools for individual investors in 2026 — what each does well, where each falls short, and how to choose based on what you need to fix.

What is a portfolio analysis tool?

A portfolio analysis tool evaluates how your investments work together — not just how individual stocks have performed, but how the portfolio functions as a system.

It answers questions your brokerage account never will: How concentrated is your risk across sectors and individual positions? Which holdings have deteriorating fundamentals? Are your accounts, taken together, actually diversified — or just numerous?

The best tools go further than diagnosis. They flag which specific positions are weakening overall quality, surface hidden concentration in ETFs you thought were diversified, and let you model the impact of a trade before you place it.

For a deeper look at the methodology behind portfolio-level analysis — what to measure, in what order, and why — see how to analyze a stock portfolio.

What is the best portfolio analysis tool?

Ziggma is the best portfolio analysis tool for self-directed investors who want to understand and improve their entire portfolio — not just research individual stocks. It covers diversification, quality, risk, impact, and income across all connected accounts in one view.

The right tool depends on what you need to fix. Morningstar is the stronger choice for fund and ETF research — its analyst ratings and historical data coverage are unmatched for that use case. Stock Rover is better suited to data-driven investors who want deep fundamental screening and custom charting. Empower is the simplest option for investors who primarily want a net worth dashboard rather than portfolio diagnostics.

For most long-term investors, the gap that matters most is portfolio-level insight — understanding how holdings interact, where risk is concentrated, and which positions are reducing overall quality. That is where Ziggma is purpose-built and the others are not.

The table below compares all four across the dimensions that matter most for portfolio analysis.

Feature
Ziggma Editor's pick
Morningstar Research
Stock Rover Data-driven
Empower Net worth
Best for Portfolio-level analysis across all accounts Fund & ETF research Deep fundamental screening Net worth tracking
Multi-account consolidation Partial
Portfolio quality score Per-holding + portfolio-level composite Partial
Impact & ESG screening Real-world metrics, not aggregate ratings ESG ratings only
Trade simulator Model a buy or sell before placing it
Stock screener Basic
Pricing Free Paid from $6.99/mo Free Premium $249/yr Free Paid from $7.99/mo Free Advisory fees vary

Impact & ESG screening on Ziggma uses real-world metrics — Global Warming Potential, carbon intensity, net-zero target dates, and harm-category exclusions — not aggregate ESG ratings. How impact screening works in Ziggma's stock screener →

What to Look for in a Portfolio Analysis Tool

The difference between a useful portfolio analysis tool and a data dashboard is whether it helps you make better decisions. These are the capabilities that separate the two.

Multi-account consolidation

Most investors hold assets at more than one broker — a brokerage account, an IRA, a 401(k). A portfolio analysis tool that only sees one account at a time gives a systematically misleading picture of true diversification and risk. The tool needs to consolidate all accounts into a single portfolio view before running any analysis. Without that, concentration risk and sector exposure numbers are simply wrong. See how to track investments across multiple accounts.

Portfolio quality scoring

Evaluating individual stocks by fundamentals is standard. Evaluating your entire portfolio by fundamentals is rarer and more useful. A quality score that covers valuation, growth, profitability, and financial health — applied to every holding and rolled up into a portfolio-level number — tells you where your weakest positions are and how much they are dragging on overall quality. The Ziggma Stock Score does this for every holding across all connected accounts.

Diversification analysis

Holding thirty stocks is not the same as being diversified. True diversification requires checking sector exposure, geographic allocation, individual position weights, and ETF overlap simultaneously. A portfolio that looks spread across twenty names may have half its value in technology when ETF constituents are counted. Look for a tool that uses a concentration metric — Ziggma uses the Herfindahl-Hirschman Index — rather than a simple holdings count. See how to reduce concentration risk.

A trade simulator

The best time to understand the impact of a trade is before you place it, not after. A portfolio optimizer or trade simulator shows how a proposed buy or sell would change your diversification, quality score, risk exposure, and income — so you can evaluate the portfolio-level consequence of any decision before committing capital. See how the Ziggma Portfolio Optimizer works.

Impact and values-based screening

An increasing number of investors want to know what their capital supports — not just what it returns. Look for a tool that goes beyond aggregate ESG ratings and surfaces the underlying data: Global Warming Potential, carbon intensity across Scopes 1–3, net-zero target dates, and harm-category exclusions. Aggregate ESG scores from providers like MSCI and Sustainalytics obscure more than they reveal. Metric-level transparency is what makes values-based portfolio decisions defensible. See how impact screening works in Ziggma's stock screener.

Best Portfolio Analysis Tools Reviewed

Ziggma — Best for Portfolio-Level Analysis and Impact Investing

Ziggma is built around a premise most investment tools ignore: that understanding your portfolio as a system matters more than researching individual stocks. It connects to virtually any U.S. broker via Plaid and Snaptrade, consolidates all accounts into one view, and runs analysis across five dimensions simultaneously — diversification, quality, risk, impact, and income.
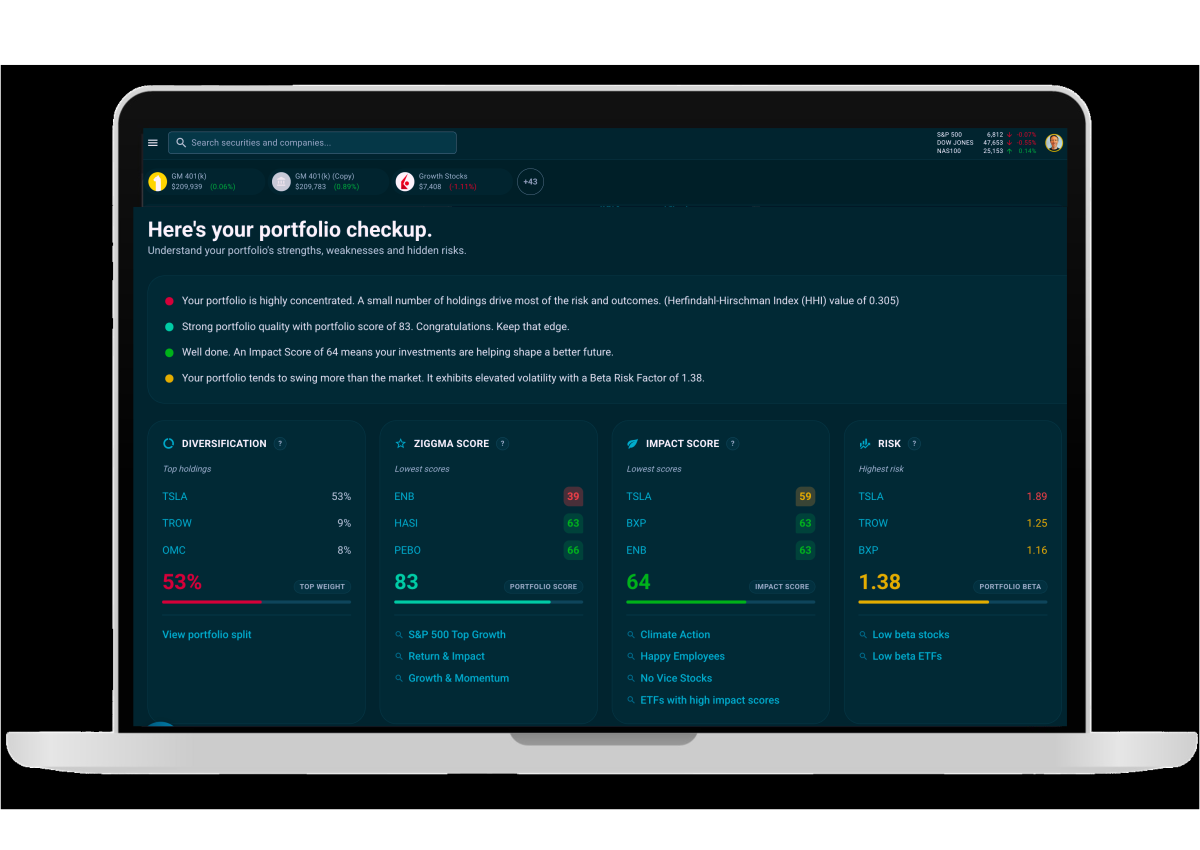
The Portfolio Checkup is the fastest entry point. It surfaces your portfolio's biggest weaknesses across all five dimensions in one diagnostic view, naming the specific holdings responsible for each problem. A concentrated position, a deteriorating quality score, a high-beta holding inflating your risk — the Checkup identifies all of it in under two minutes.
Quality scoring is where Ziggma differentiates most clearly from general-purpose trackers. The Ziggma Stock Score rates every holding from 0–100 across valuation, growth, profitability, and financial health. It rolls up to a portfolio-level quality score so you can see whether your aggregate exposure is improving or declining over time — not just whether individual positions are up or down.
The Portfolio Optimizer adds a pre-trade simulation layer. Before placing any buy or sell, you can model how it would change your diversification, quality, risk, impact, and yield. Most brokers only surface this information after a trade is executed. Ziggma surfaces it before.
On the impact side, Ziggma uses ACA Ethos institutional data rather than aggregate ESG ratings. Every holding is scored on Global Warming Potential, carbon intensity, net-zero target date, fair labor practices, and controversy level. The same metrics are filterable in the stock screener, so you can find replacement candidates that meet both financial and impact criteria simultaneously. See how impact screening works in the Ziggma stock screener.
Ziggma is free to start. The Portfolio Checkup, Stock Scores, Portfolio Optimizer, and full impact data are available on paid plans from $6.99/month, with a 7-day free trial. See Ziggma plans and pricing.
Ziggma portfolio checkup illustration

Morningstar — Best for Fund and ETF Research

Morningstar is the most widely used investment research platform for individual investors. Its strength is depth of coverage on mutual funds and ETFs — analyst ratings, category rankings, historical performance data, and the star rating system that has become a default reference point for fund evaluation.
For investors whose portfolios are built primarily around funds rather than individual stocks, Morningstar's research library is genuinely valuable. The X-Ray tool provides a look-through of ETF and fund constituents to surface underlying sector and geographic exposure.
Where Morningstar is weaker is portfolio-level optimization. It does not score individual stocks with a composite quality rating, does not simulate trades, and does not offer meaningful impact or ESG data beyond broad category labels. Its portfolio tools are better described as aggregation than analysis — they show you what you own but offer limited guidance on what to do about it.
Morningstar Premium costs $249 per year. For investors who primarily want fund research and analyst ratings, that is defensible. For investors who want to understand and improve their portfolio as a whole, it leaves the most important questions unanswered.

Stock Rover — Best for Fundamental Stock Screening

Stock Rover is a data-intensive platform built for investors who want to screen stocks by fundamental criteria and build custom watchlists. Its screener is among the most flexible available to retail investors — covering revenue growth, margins, valuation multiples, balance sheet metrics, and dividend history with granular range filters.
Portfolio analysis features are available but secondary. Stock Rover can aggregate holdings across accounts and display sector allocation, but it does not produce a composite quality score, a trade simulator, or impact data. The tool rewards investors who already know what they are looking for and want to apply it systematically across a large stock universe.
The free plan is limited. Meaningful screening capability requires a paid plan starting at $7.99/month. Stock Rover is a strong complement to a portfolio tracker rather than a replacement for one — it helps you find stocks; it does not help you understand how the stocks you already own work together.

Empower — Best for Net Worth Tracking

Empower (formerly Personal Capital) connects to bank accounts, brokerage accounts, credit cards, and retirement accounts to produce a unified net worth dashboard. For investors whose primary need is seeing all their finances in one place, it does that job simply and reliably.
Portfolio analysis capability is limited. Empower shows asset allocation and a basic fee analyzer, but it does not score individual holdings by quality, simulate trades, or surface impact data. It is better understood as a financial aggregator than a portfolio analysis tool.
Empower is free for the tracking and net worth features. Its advisory services carry separate fees. For investors who want portfolio diagnostics beyond net worth and allocation, a dedicated portfolio analysis tool will cover substantially more ground.

Which Portfolio Analysis Tool Should You Choose?

The right tool depends on the problem you are trying to solve.
Choose Ziggma if you want to understand your portfolio as a whole — not just individual stocks. It is the right fit if you hold accounts at more than one broker, want to know where your risk is actually concentrated, care about the quality of your holdings beyond price movement, or want to align your portfolio with your values without relying on opaque ESG labels. It is also the right fit if you want to model a trade before placing it. Most self-directed long-term investors will find it covers more ground than any other tool on this list.
Choose Morningstar if your portfolio is built primarily around mutual funds and ETFs and you want deep research on those vehicles. Analyst ratings, fund category rankings, and historical performance data are Morningstar's genuine strengths. If individual stock analysis and portfolio optimization are not priorities, Morningstar Premium is a defensible investment. If they are, it will leave the most important questions unanswered.
Choose Stock Rover if you already have a portfolio tracker and want a dedicated stock screener to find new ideas. Its fundamental screening depth is hard to match at the retail level. It is a strong complement to Ziggma rather than a replacement — use Stock Rover to find candidates, Ziggma to understand how they would affect your portfolio before you buy.
Choose Empower if your primary need is seeing all your finances — bank accounts, credit cards, retirement accounts, brokerage accounts — in one place. It is the simplest net worth dashboard available and does that job well. For investors who want portfolio diagnostics beyond asset allocation, it will not go far enough.
If you are unsure where to start, run the free Ziggma Portfolio Checkup. It takes under two minutes, requires no credit card, and will show you exactly which dimensions of your portfolio need attention — which is the fastest way to know which tool you actually need.

Free to start — no credit card required

Get a full analysis of your portfolio in under two minutes

Connect any broker and Ziggma gives you a complete picture of your portfolio: diversification, quality scores for every holding, risk exposure, income, and impact — across all your accounts in one view.

Portfolio Checkup across 5 dimensions
Ziggma Stock Score for every holding
Multi-account consolidation
Impact and ESG screening
Trade simulator before you commit

7-day free trial · All features included · No credit card required

FAQ

The best portfolio analysis tool depends on what you need. Ziggma is best for investors who want to understand and improve their entire portfolio across multiple accounts — with quality scoring, diversification analysis, risk tracking, and impact data in one place. Morningstar is best for fund and ETF research. Stock Rover is best for deep fundamental screening. Empower is best for a simple net worth overview. For a full breakdown, see the best free portfolio trackers compared.

A portfolio analysis tool evaluates how your investments work together — not just how individual stocks perform. It surfaces diversification gaps, concentration risk, quality scores across holdings, income and dividend data, and risk exposure. The best tools also flag weak positions and suggest improvements. Ziggma's Portfolio Checkup covers all five dimensions in one diagnostic view: diversification, quality, impact, risk, and income.

Yes — Ziggma connects to virtually any U.S. broker via Plaid and Snaptrade, both SOC 2 Type II certified. The connection is read-only; Ziggma can see your holdings but cannot place trades. Once connected, all accounts are consolidated into a single portfolio view before any analysis runs. This matters because analyzing accounts in isolation gives a misleading picture of true diversification and risk. See the full guide on how to track investments across multiple accounts.

The Ziggma Stock Score is a 0–100 composite rating of a company's fundamental quality. It covers four dimensions: Valuation, Growth, Profitability, and Financial Health. A score above 70 signals strong overall quality. The score appears for every holding in your portfolio and is also available as a filter in Ziggma's stock screener. It gives you a consistent, objective standard to evaluate any position without reading earnings reports manually. See how the Ziggma Stock Score is calculated →

Morningstar is primarily a research tool — it tells you about individual stocks, funds, and analyst ratings. Ziggma is a portfolio tool — it tells you how your actual holdings work together. Morningstar helps you decide what to buy. Ziggma helps you understand what you already own, where the risk is concentrated, and how to improve the portfolio as a whole. The two tools are complementary rather than competing. For a head-to-head breakdown, see Ziggma vs Morningstar.

Yes — and the approach is different from standard ESG ratings. Ziggma doesn't use aggregate ESG scores from providers like MSCI or Sustainalytics. Instead it surfaces underlying impact metrics: Global Warming Potential, carbon intensity across Scopes 1–3, net-zero target dates, and harm-category exclusions (fossil fuel, weapons, alcohol, conflict minerals). These appear in the portfolio Impact tab and are filterable in the stock screener. See how impact screening works in Ziggma's stock screener →

Concentration risk occurs when a portfolio's returns are driven by a small number of holdings, sectors, or geographic exposures — meaning a single bad outcome has outsized impact. Ziggma measures this using the Herfindahl-Hirschman Index (HHI) and flags individual holdings, sectors, and asset types that exceed healthy weight thresholds. True diversification goes beyond holding many names — you need to check sector overlap, ETF constituent duplication, and geographic allocation simultaneously. See how to reduce concentration risk in your portfolio.

Yes. Ziggma's Portfolio Optimizer lets you simulate any buy or sell and see how it changes your portfolio across five dimensions — diversification, quality, risk, impact, and yield — before you commit. Most brokers only show you the impact of a trade after it's executed. Ziggma shows it before. This is particularly useful when evaluating whether a new position improves or worsens your overall portfolio profile.

The Ziggma Portfolio Checkup is a diagnostic that evaluates your portfolio across five dimensions in one view: diversification (including sector and geographic spread), quality (Ziggma Stock Score for every holding), impact (Global Warming Potential, Impact Score, harm exposures), risk (Beta Risk Factor, volatility), and income (dividend yield and forward cash flow). It surfaces your three weakest holdings in each dimension so you know exactly where to focus. It takes under two minutes to run after connecting a brokerage account.

Ziggma has a free plan that includes core portfolio tracking and basic analysis. The Portfolio Checkup, Ziggma Stock Scores, Portfolio Optimizer, Smart Alerts, and full impact data are available on paid plans starting at $6.99/month. A 7-day free trial gives access to all features with no credit card required. See all Ziggma plans and pricing →