Understand your portfolio's performance and its climate impact in one place — then improve both.
Most investing platforms tell you what your portfolio is worth. Ziggma also tells you what it costs the planet, and gives you the tools to change that. In a few minutes, you can measure your portfolio's climate footprint, find lower-impact alternatives, and rebuild around holdings that align with the world you want to invest in. Learn what climate impact means for your portfolio.
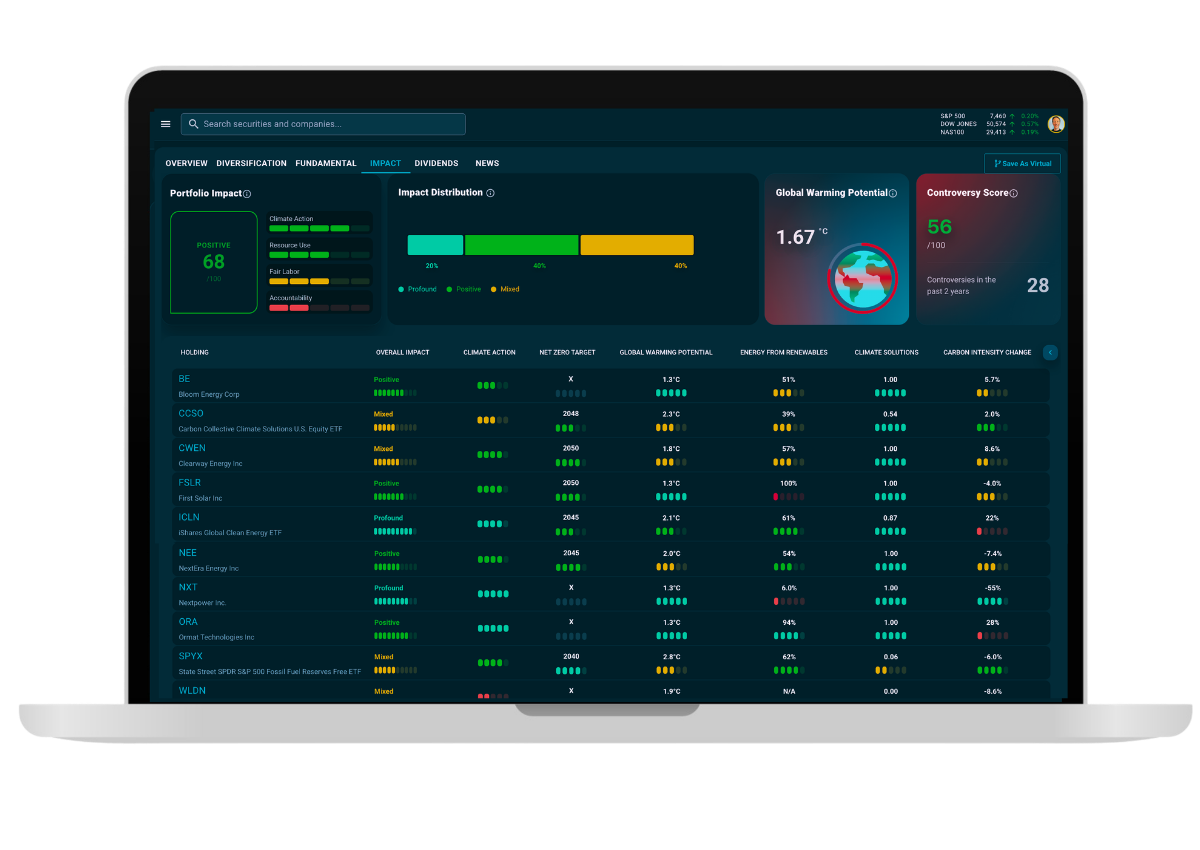
When you connect a portfolio in Ziggma, you'll see a metric we call Global Warming Potential, expressed in degrees Celsius — for example, 1.92 °C or 2.28 °C.
A quick note on the name, because precision matters when you're making decisions with your money: what we display is technically an Implied Temperature Rise (ITR). It's an estimate of how much global warming the world would experience by 2100 if the entire economy operated like the companies in your portfolio, relative to their stated emissions pathways and science-based benchmarks.
"Global Warming Potential" in formal climate science refers to something different — it's a coefficient used to compare the warming effect of different greenhouse gases (methane vs. CO₂, for instance). We use the more intuitive label in the app because it communicates the idea faster to investors who aren't climate scientists. But under the hood, the number you see is ITR, and it answers a question every climate-aware investor should be asking: is my money pulling the planet toward 1.5 °C, 2 °C, or 3 °C?
Ziggma doesn't currently compute a portfolio-level carbon footprint (tonnes of CO₂e). ITR is, for most investors, the more actionable signal: it's forward-looking, it incorporates company commitments and trajectories, and it maps directly onto the Paris Agreement targets you already know.
.png)
Implied Temperature Rise maps your portfolio onto the same scale climate scientists use to describe global warming pathways. A quick reference:
1.5 °C — Aligned with the Paris Agreement's most ambitious target. Limits the most severe climate impacts. Few diversified portfolios sit here today without deliberate construction.
Below 2.0 °C — Aligned with the Paris Agreement's headline goal. Significant climate disruption but within bounds most scientists consider manageable.
2.0–2.7 °C — Where most diversified equity portfolios sit today. Above the Paris targets but below worst-case scenarios.
Above 3.0 °C — Trajectory associated with severe, compounding climate impacts. Often signals heavy exposure to fossil fuel production or high-emitting industrials without credible transition plans.
Bringing your portfolio's number down doesn't require divesting from entire sectors. It typically means selecting the companies within each sector that have credible decarbonization commitments and are already shifting their energy mix. To understand where your portfolio sits on this scale today, start by checking your portfolio's climate score.

S&P 500 Implied Temperature Rise per Ziggma data as of May 2026. Published estimates from other providers vary based on methodology.
If you've never seen an Implied Temperature Rise figure for your portfolio before, there's a reason. Climate data at this level — company-by-company temperature alignment, carbon intensity trajectories, renewable energy mix, controversy tracking — has historically lived inside Bloomberg terminals and institutional research subscriptions costing thousands per seat.
Most retail brokerages don't display it. Most robo-advisors abstract it away inside a single ESG score. Most "sustainable investing" apps either lock you into pre-built thematic portfolios or stop at fund-level labels that obscure what you actually own.A handful of platforms have started bringing this data to self-directed investors, with different tradeoffs in coverage, depth, and how much control you keep over your portfolio.
We've compared them side by side:→ The best platforms for climate-aligned investing in 2026.
If you're new to this and want to start with your own portfolio first, see how climate-friendly your portfolio actually is.
Knowing the climate impact of your investments is step one. Here's how Ziggma lets you act on it — something almost no consumer investing platform offers in a self-directed way.
Connect your brokerage and Ziggma calculates Global Warming Potential, Portfolio Impact Distribution (Profound / Positive / Mixed / Negative), Climate Action, Sustainable Resource Use, and a Controversy Score across your holdings. You'll see which specific positions are heating your portfolio — Pitney Bowes at 2.1 °C, NVIDIA at 1.5 °C, Gilead at 1.5 °C — and which are dragging the average up.
This is where most users find their biggest wins. Open the Stock Screener, go to the Impact filter theme, and:
The Screener becomes a shortlist of replacement candidates that meet your climate threshold and your financial criteria at the same time.
For example, start with the net-zero filter to build a shortlist of replacements. The guide to how to screen for net-zero companies walks through the exact filters — target date, carbon intensity across Scopes 1–3, and trajectory — with a Ziggma Stock Score quality overlay.
Once you've identified a candidate, use the Portfolio Optimizer to model the trade. It shows you how a buy or sell would shift your Diversification, Portfolio Quality, and Impact Score before you commit a dollar. You can iterate — sell a high-temperature holding, buy a screener pick, and watch the portfolio-level number come down.
A note on what the Optimizer does not do yet: it doesn't let you set Global Warming Potential as a direct optimization target. To reduce your portfolio's temperature, the path is Screener first, Optimizer second — use the Screener to find lower-impact holdings, then use the Optimizer to test how adding them reshapes your portfolio. Direct climate optimization is on our roadmap.
Take a portfolio heavily weighted toward US tech and industrials, sitting at 2.4 °C Global Warming Potential. The Impact dashboard flags three holdings as the biggest contributors: a logistics company at 2.6 °C, a midstream energy name at 3.1 °C, and a chemicals manufacturer at 2.8 °C.
In the Screener, applying a maximum GWP of 2.0 °C and a minimum 50% energy-from-renewables filter — still within the same sectors — surfaces eight candidate replacements, each with comparable market cap and a Ziggma Quality Score above the portfolio average.
Modeling two of those replacements in the Optimizer shows the portfolio shift from 2.4 °C to 1.9 °C, with no degradation in diversification and a modest improvement in dividend yield.
The point isn't that every portfolio works out this cleanly. The point is that the data and tools required to even attempt this trade — at the position level, on your real holdings — exist on Ziggma and almost nowhere else for self-directed investors.
Most investors who care about climate are stuck choosing between a thematic ESG fund (where someone else picks the holdings and the methodology is opaque) and a regular brokerage (where climate data simply isn't surfaced). Ziggma sits in between: you keep direct ownership and control of your portfolio, and you get the institutional-grade impact data — temperature alignment, carbon intensity trends, renewable energy mix, controversies — that's normally locked inside professional terminals.
You decide what "climate-aligned" means for your portfolio. Ziggma gives you the numbers and the tools to get there.
Implied Temperature Rise is one lens. A complete climate-aligned investing approach also considers:
If you're ready to act on what you find, our best fossil-free stocks for 2026 gives you a quality-screened starting point for replacing high-exposure holdings.
