.png)
What the metrics mean, how to read them, and what to do when your portfolio is off course.
For the full guide to acting on climate data through your portfolio — including screening strategies and greenwashing avoidance — see the Ziggma Sustainable Investing Guide for 2026.
Your broker or retirement account administrator doesn't show you the climate impact of what you own. Most investing platforms display price, return, and maybe a dividend yield. None of that tells you whether your portfolio is aligned with a 1.5 °C world or a 3 °C world.
The climate impact of our investments is big. A standard S&P 500 index fund currently implies a global warming pathway of approximately 4.1 °C — far above the Paris Agreement target of 1.5 °C. Most investors don't know that number. Their platform doesn't surface it.
Ziggma surfaces this footprint. It computes a Global Warming Potential figure for every stock and ETF in your portfolio — and rolls it up into a single portfolio-level number, even when your holdings are spread across multiple brokers.
The climate impact of an investment is best measured by its Implied Temperature Rise (ITR). ITR answers one question: if the entire global economy operated the way the companies in this portfolio do, how much would the planet warm by 2100?
It is expressed in degrees Celsius. A stock rated at 1.5 °C is aligned with the Paris Agreement's most ambitious target. A stock at 3.0 °C is on a high-warming trajectory. ITR is forward-looking. It incorporates a company's current emissions, its carbon intensity trend, and its stated net-zero commitments — not just a snapshot of today's CO₂ output.
That makes it more actionable than a raw carbon footprint. A company can have high current emissions but a credible decarbonization roadmap that puts it on a 1.5 °C trajectory. Another can appear "clean" today while showing no commitment to further reduction. Ziggma surfaces ITR — displayed as Global Warming Potential in the app — for every individual stock and ETF, and aggregates it across your full portfolio.
Climate impact can be measured at four levels: portfolio, holding, company, and trajectory.
Most platforms that surface any climate data stop at a single aggregate ESG score, which reflects climate risk to the company, not the company's climate impact Climate-minded investors need a breakdown of their investments' climate impact into the underlying components that actually explain the number.
Portfolio level
Holding level (per stock or ETF)
Broader impact context (also surfaced in the Impact tab)
Collecting this data is no trivial task. A company that excels at this task is ACA Ethos, an institutional-grade impact data provider used by asset managers, pension funds, and ESG research teams.
→ See the full impact data methodology.
Connect your brokerage account, and Ziggma calculates your portfolio's climate impact in minutes.
Step 1: Link your accountsZiggma connects to virtually any U.S. broker — Fidelity, Schwab, Robinhood, Webull, TD Ameritrade, and dozens more — via Snaptrade or Plaid, both SOC 2 Type II certified. The connection is read-only: Ziggma can see your holdings but cannot place trades.
If you hold accounts at more than one broker, link them all. Ziggma consolidates your holdings across every account into a single portfolio view before computing climate metrics. → See how to track investments across multiple accounts.
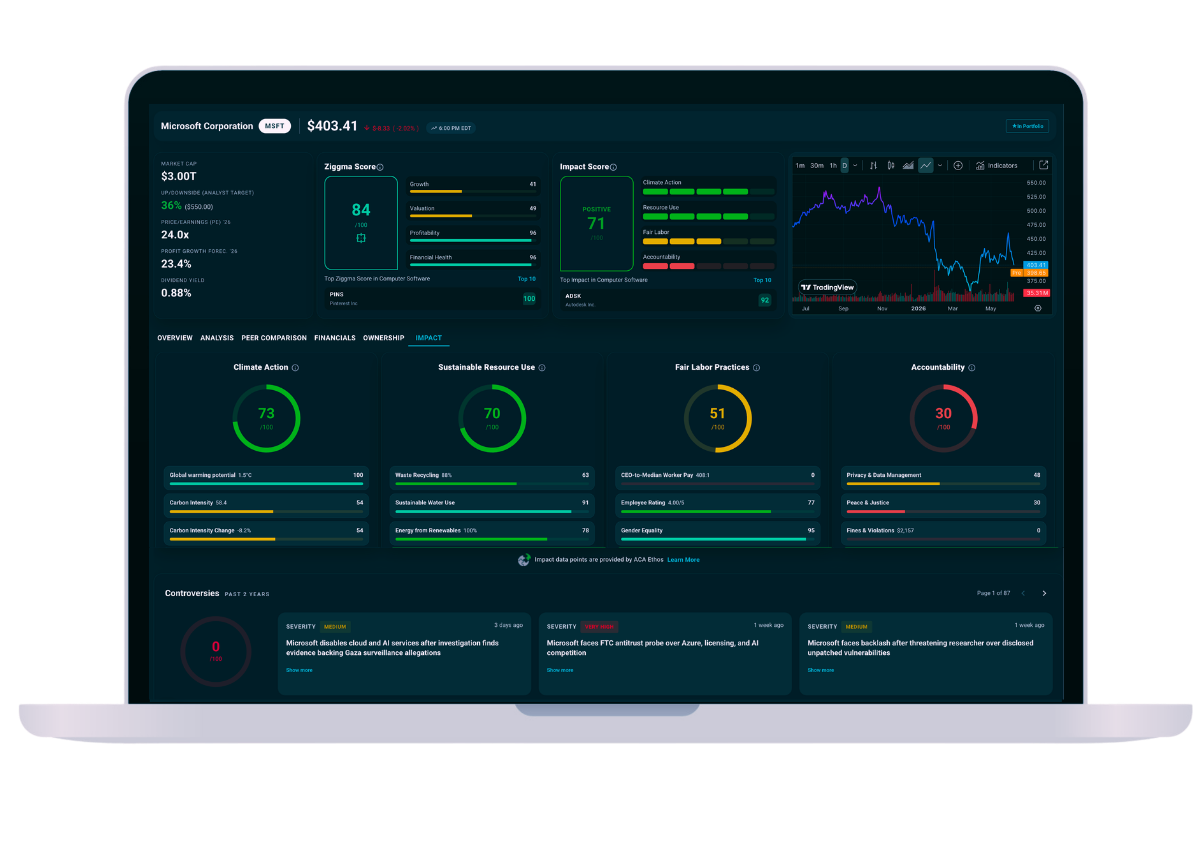
Step 2: Open the Impact tabOnce your accounts are connected, navigate to the Impact tab in the portfolio dashboard. You'll see your Global Warming Potential in °C, your Portfolio Impact Score, and your Impact Distribution across all holdings.
Step 3: Drill into individual holdingsClick any holding to see its individual climate breakdown — Climate Action score, ITR, carbon intensity, renewable energy share, net-zero target date, and controversy score. This is where you identify which specific positions are driving your portfolio's temperature up.
Step 4: Run the Portfolio CheckupThe Portfolio Checkup surfaces your portfolio's biggest risk factors in one place — including impact. It flags holdings with the worst climate scores so you know exactly where to focus.
Your portfolio's Global Warming Potential tells you which Paris Agreement scenario your investments are aligned with.
The S&P 500 currently reads approximately 4.1 °C on Ziggma data. Most investors holding a standard index fund are significantly above Paris targets without realizing it.
A Climate Action score of 73/100 for an individual stock means that company ranks in the top tier of its sector for climate performance. A score of 29/100 for a different holding explains why it's dragging your portfolio's average up.
Once you understand your portfolio's climate impact, the next step is knowing what levers actually exist to change it. Climate impact is one of five metrics worth actively managing — alongside return, risk, diversification, and income. See the full investment analysis and portfolio management framework for how all five fit together.
There are three practical approaches self-directed investors use.
1. Replace individual high-impact holdings: The most direct lever. Identify which positions are pulling your portfolio's temperature up, then screen for lower-impact alternatives within the same sector. Replacing a logistics company at 2.8 °C with a competitor at 1.6 °C reduces your portfolio's aggregate ITR without changing your sector exposure.
2. Audit your ETFs and mutual funds: Many investors assume their fund holdings are neutral. A fund labeled "ESG" by its issuer may still carry a 2.5 °C or higher temperature alignment once the constituent holdings are analyzed. Checking the climate metrics of each ETF — not just the label — often surfaces the biggest surprises.
3. Use financial screeners that include climate filters: Standard brokerage screeners filter by P/E ratio, dividend yield, and sector. They do not filter by Global Warming Potential, carbon intensity, or net-zero target date. Screeners that combine financial and climate criteria let you identify replacement candidates that meet both sets of requirements at once — rather than running two separate processes and hoping the results overlap.
The full workflow is straightforward: identify your worst climate offenders, find financially sound alternatives with a lower temperature alignment, model the portfolio impact before trading. For a step-by-step guide to executing that process, see how to reduce the climate impact of your portfolio.
For a deeper look at how portfolio temperature is scored, see how climate-friendly your portfolio is.
Once you know your portfolio's climate footprint, the next step is to replace high-emitting holdings. Screen for net-zero companies using Ziggma's Impact filter panel to find verified alternatives with published target dates and falling carbon intensity.
Finding climate-aligned replacements sounds straightforward in theory. In practice, it runs into an immediate obstacle: standard stock screeners — on brokerage platforms, financial data sites, and most independent tools — do not include climate criteria. There is no filter for Global Warming Potential on Fidelity, Schwab, or Bloomberg's retail interface. There is no carbon intensity slider on most independent screeners. Investors who want to screen by climate metrics today have very few options, and most of what exists stops at a broad ESG rating rather than exposing the underlying data. That gap is worth understanding before choosing a tool.
To screen for climate-aligned stocks, you need a screener that exposes the underlying climate data at the individual company level. The filters that matter most are:
Global Warming Potential — the single most useful filter. Set a maximum ITR — for example, 2.0 °C — to surface only companies whose emissions trajectory is aligned with the Paris Agreement. This eliminates companies with no credible decarbonization path regardless of how they are labeled.
Carbon Intensity — tonnes of CO₂e per million dollars of revenue. Useful for comparing companies within the same sector, where absolute emissions vary by business size. A declining carbon intensity trend matters as much as the current level.
Net-Zero Target Date — whether a company has made a formal, dated commitment to net-zero emissions. A company with no target scores differently from one committed to net-zero by 2040, even if both have similar current emissions. ITR incorporates this forward commitment.
Percent of Energy from Renewables — the share of total energy consumption already running on clean power. A high renewable energy share today is a leading indicator of a lower temperature trajectory tomorrow.
Climate Solutions — a classification that identifies companies whose core products or services actively reduce emissions elsewhere in the economy. A solar panel manufacturer or grid-efficiency software company contributes differently than a company merely reducing its own footprint.
Two principles apply regardless of which tool you use. First, always combine climate filters with financial quality filters — a low-ITR stock with deteriorating fundamentals is not a sound replacement for a high-ITR stock with strong earnings. Second, screen within sectors rather than across them. Replacing an industrial holding with a technology company changes your portfolio's risk profile in ways unrelated to climate. The goal is finding the best climate performers within each sector you already want to own.
Two principles apply regardless of which tool you use. First, always combine climate filters with financial quality filters — a low-ITR stock with deteriorating fundamentals is not a sound replacement for a high-ITR stock with strong earnings. Second, screen within sectors rather than across them. Replacing an industrial holding with a technology company changes your portfolio's risk profile in ways unrelated to climate. The goal is finding the best climate performers within each sector you already want to own.
Understanding your portfolio's climate impact is the first step. The second is replacing high-impact holdings with companies that meet a higher standard.
Ziggma's impact screener lets you filter over 6,000 stocks by Global Warming Potential, carbon intensity, and net-zero target date — alongside financial quality scores. You can apply the Fossil Fuel Free preset in one click, then add GWP and carbon intensity sliders to narrow further.
→ How to screen stocks by impact data and values — not ESG ratings
