Get 360° tracking of your investments in one clean dashboard.
→ Diversification, risk and quality
→ Real-world impact of investments
→ Start with read-only portfolio sync, file upload or test with a virtual portfolio
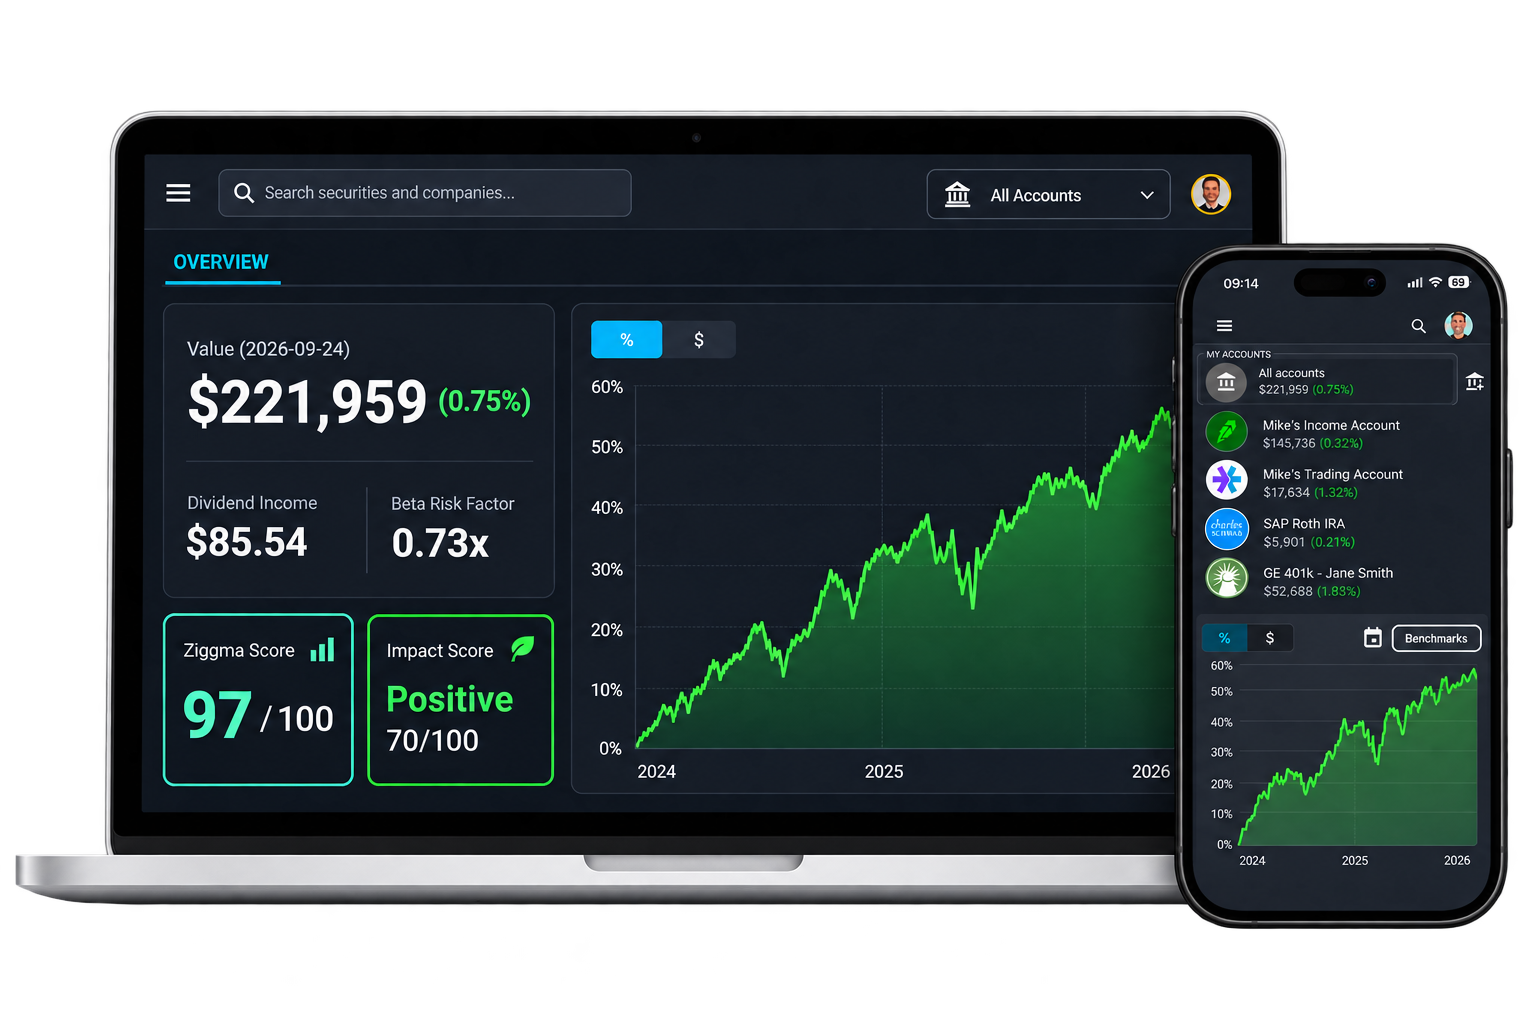
Ziggma goes beyond price and performance — giving you a complete picture of your portfolio across six dimensions that actually drive long-term outcomes.
Most portfolios have hidden concentrations. Ziggma breaks yours down by asset class, industry, and country. It flags any position or sector that's grown too large.
Not all holdings earn their place. Every stock gets a Ziggma Stock Score across growth, valuation, and financial health, so you can see at a glance what's pulling its weight.
You can't align money you can't measure. Ziggma scores each holding on climate action, labor practices, and accountability, so you know what you're actually funding.
Dividend income is scattered across accounts and hard to project. See your full 12-month forward cash flow in one view, broken down by holding.
Risk hides until it doesn't. Ziggma monitors portfolio beta and sector concentration across all accounts and flags your most exposed positions before markets move.
You can't watch your portfolio all day. Set your thresholds once. Ziggma monitors continuously and alerts you when it's time to act.
Most trackers tell you what you own. Ziggma tells you what it means.
| Ziggma | Broker App | Spreadsheet | |
|---|---|---|---|
| Multi-account aggregation | ✓ | Partial | Manual |
| Diversification analysis by industry & country | ✓ | Partial | ✗ |
| Fundamentals-based quality scoring per holding | ✓ | ✗ | ✗ |
| Portfolio impact & sustainability scoring | ✓ | ✗ | ✗ |
| 12-month forward dividend cash flow | ✓ | Partial | Manual |
| Customizable concentration limit alerts | ✓ | ✗ | ✗ |
| Pre-trade portfolio simulation | ✓ | ✗ | ✗ |
| Free tier available | ✓ | ✓ | ✓ |
Free portfolio tracker
Connect your accounts, and Ziggma does the rest — no spreadsheets, no manual entry, no switching between platforms.
Link your brokerage and retirement accounts in a few clicks. Ziggma supports accounts held at different brokers and aggregates everything into a single unified dashboard. Connections are read-only and secure — see is Plaid safe for linking accounts for details.
Ziggma instantly analyzes your consolidated holdings across diversification, quality, impact, risk, and income — giving you a complete view you can't get from any single broker.
Define your own rules — concentration limits, buy and sell signals, dividend thresholds. Ziggma monitors your portfolio continuously and notifies you when action is needed.
Use the Portfolio Checkup to identify weaknesses and the Portfolio Optimizer to simulate improvements before you act. Tracking is the foundation — Ziggma helps you build on it.
Most trackers show you what you own. Ziggma shows you what it means, and what to do about it.
Ziggma doesn't just display your holdings. It analyzes them. Every tab surfaces a different layer of insight, from fundamentals to impact to income, giving you the full picture in one place.
Once you can see your portfolio clearly, Ziggma gives you the tools to act on what you find. Run a checkup to identify what needs attention, then simulate improvements before committing to any trade.
Connect your brokerage and retirement accounts in a few clicks. Ziggma aggregates everything into one unified view — no switching between platforms required. Once connected, you can track return, risk, diversification, income, and impact across all your holdings at once. Here's how to interpret and act on what you see.
 Fidelity
 Charles Schwab
 Vanguard
 E*TRADE
 Robinhood
 Interactive Brokers
 Coinbase
Connect your accounts and get a complete analytical picture across diversification, quality, impact, risk, and income — in minutes.
Start Tracking FreeEverything you need to know about Ziggma's free portfolio tracker.
How to actually move the needle. Why public markets are where real impact happens, and how to act on it.
No spam. No newsletter — we'll only reach out for major updates.